Show a live value with its colour and quality
Beginner · 8 min · Indicator
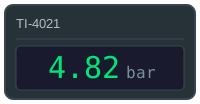
ValueText = 4.82 colour = green 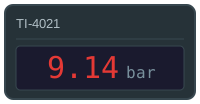
ValueText = 9.14 colour = red 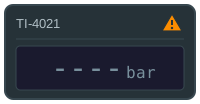
BadQuality = true
The problem
Value fields are usually just fields — a number with a static colour. When the instrument fails, the last good reading sits there looking exactly like a live one, and the only way to find out is to notice that it has not changed for a while.
Where colour is used, it tends to be reimplemented per field: a comparison against a limit written into the graphic, which then disagrees with the alarm list the moment either one is edited. Two places deciding the same thing is one place too many.
What you need
A reading tile with the value as its own text element and a badge in a corner — the example below uses the data tile from the sample set. The tag name and the unit stay static text: they belong to the measuring point, and a widget placed once per point can carry them in the drawing.
From the PLC you need the value as text, a colour, and the quality bit your driver already provides.
| Parameter | Type | What it does |
|---|---|---|
| ValueText | string | The reading, already formatted — decimals, blanking, all of it. |
| ValueColor | HmiColor | The colour the value should be, supplied by the alarm logic. |
| BadQuality | boolean | True when the reading cannot be trusted. |
Build it
1. Bind the value
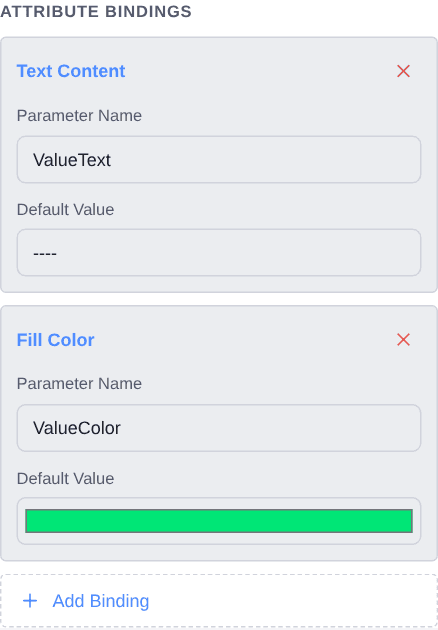
Select the value and add a Text Content binding named
ValueText. A string, not a number — how many decimals, whether an out-of-range reading blanks, what a failed instrument shows — are all decisions that belong with whatever scales the tag.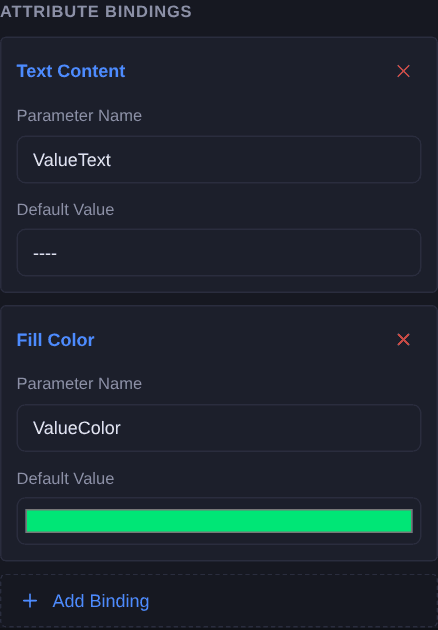
2. Take the colour from the alarm logic
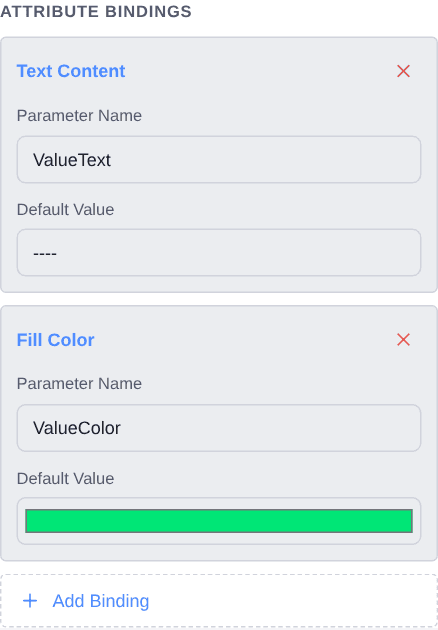
With the value still selected, add a Fill Color binding named
ValueColor. It takes a colour, so the decision about what counts as high, low or normal stays wherever your limits already live.Doing it with conditions here instead would mean writing the limits into every graphic that displays a value, and then keeping all of them in step with the alarm list.
3. Show a badge when the reading is bad
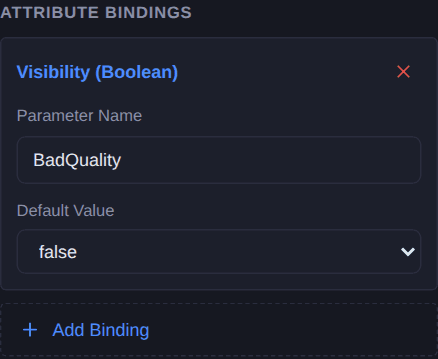
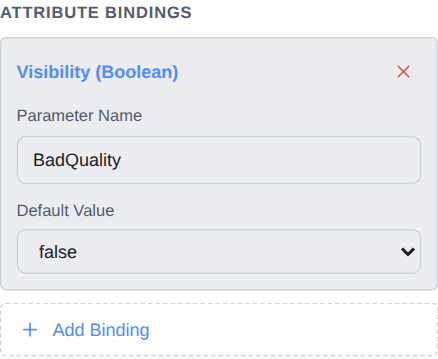
Select the quality badge and add a Visibility (Boolean) binding named
BadQuality. Most drivers already give you this; it is usually the piece nobody puts on the screen.A badge rather than blanking the number, because “this reading is stale” and “there is no reading” are different, and the last known value is often exactly what an operator wants while they work out what failed.
Check it
Open Simulate and set BadQuality while leaving a value in place. The badge should appear over a still-readable number — showing the last value and flagging that it cannot be trusted is more useful than hiding both.
Then change ValueColor. The colour and the text are separate bindings on the same element, so either can change without the other.
Simulate needs a free account. Everything up to this point does not.
Variations
- Bind the tag and unit too. If one tile is reused for several points — a selector, a detail pane — add a Text Content binding to each of them and the tile follows whatever is selected.
- Colour from a state instead. If you would rather the graphic decide, swap the colour binding for Cond. Fill (Number) and give each alarm state a row.
- Dim the whole tile. A Fill Opacity binding on the tile background makes a stale reading recede rather than sit at full contrast alongside live ones.
Questions
- Why is the value a string rather than a number?
- So the formatting lives with whatever scales the tag. Decimals, blanking an out-of-range reading, what a failed instrument shows — all of that is one decision made once, rather than a property of the graphic.
- Why not decide the colour from the value here?
- Because the limits already exist in the alarm logic. Writing them into the graphic means two places that can disagree, and they will the first time either is edited.
- Why not bind the tag name?
- It describes the measuring point rather than the reading, and it does not change while the screen is open. A widget placed once per point can carry it as static text; bind it if one tile serves several points.
- Why a badge instead of blanking a bad reading?
- "This reading is stale" and "there is no reading" are different things. The last known value is often what an operator wants while they work out what failed.