Build a bar graph that recolours at its limits
Intermediate · 10 min · Indicator
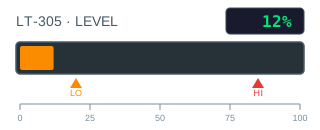
Value = 12 LoLimit = true 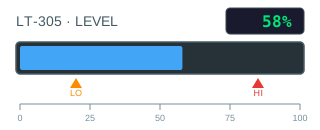
Value = 58 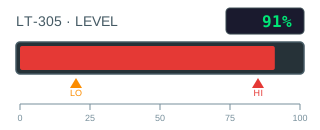
Value = 91 HiLimit = true
The problem
The usual bar is three rectangles stacked — one green, one amber, one red — with visibility dynamics deciding which shows. Three objects to resize when the layout changes, and three chances for the comparisons to overlap or leave a gap.
It also conflates two independent facts. How full the bar is comes from the value; what colour it is comes from the limits, and those limits usually have hysteresis and delays that the graphic has no business reimplementing. Keeping them separate means the alarm logic stays in one place and the bar simply displays what it decided.
What you need
A bar graphic whose fill is a rectangle with a fixed left edge — the example below is drawn at full scale, which is deliberate: the arithmetic is derived from that full-scale geometry, so the drawing carries the numbers you need.
From the PLC you need the value as a number and the two limit bits your alarm logic already produces.
| Parameter | Type | What it does |
|---|---|---|
| Value | string | The value in percent, 0 to 100. |
| HiLimit | boolean | HI limit, from the alarm logic. |
| LoLimit | boolean | LO limit, from the alarm logic. |
| ValueText | string | The number in the readout, already formatted. |
Build it
1. Make the bar as long as the value
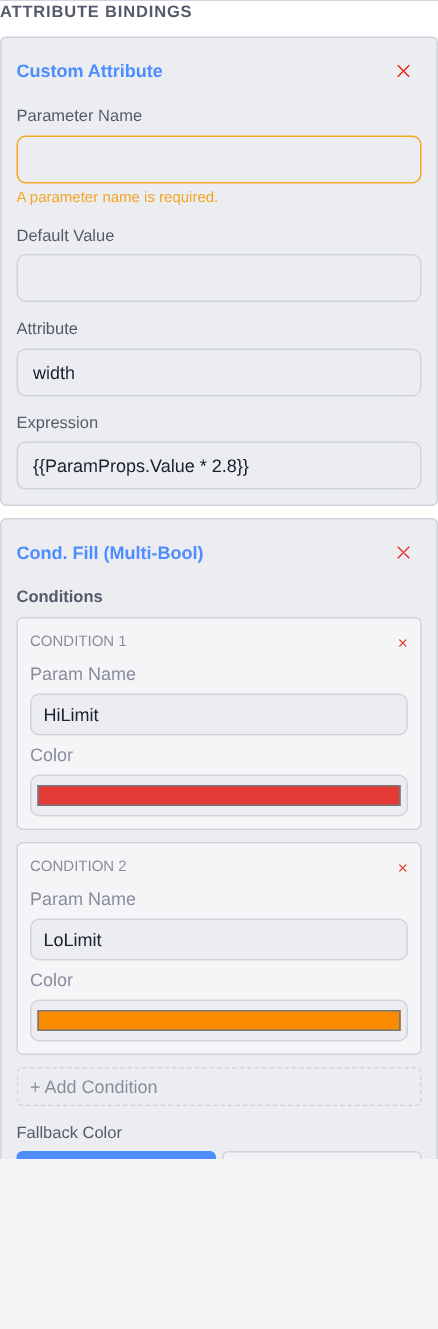
Select the bar and add a Custom Attribute binding. Set the attribute to
widthand the expression to{{ParamProps.Value * 2.8}}.The bar in the example starts at
x=20and is 280 units long at full scale, so one percent is 2.8 units. Because the left edge never moves, width alone is the whole geometry — nothing else needs a binding.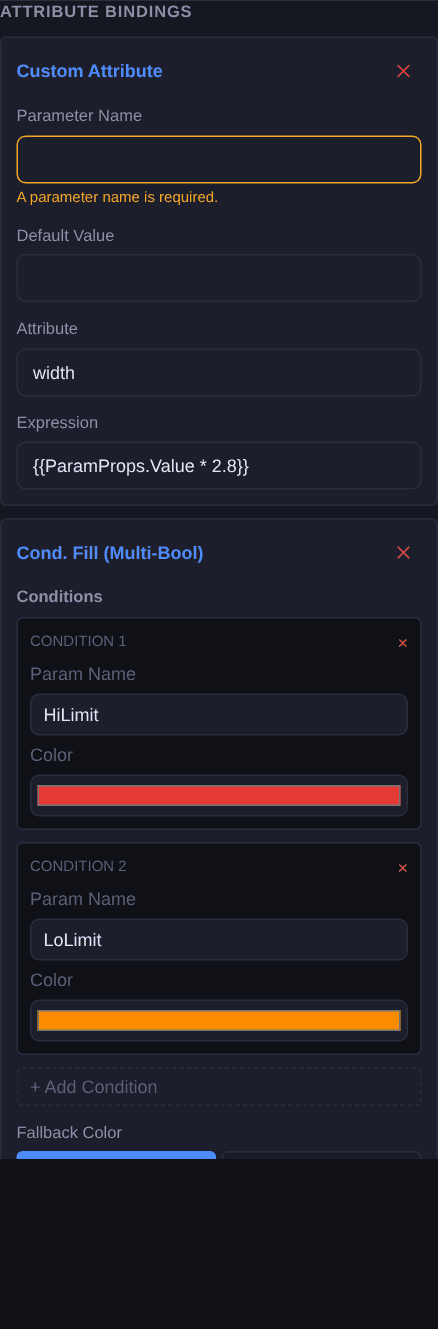
2. Colour it from the limits
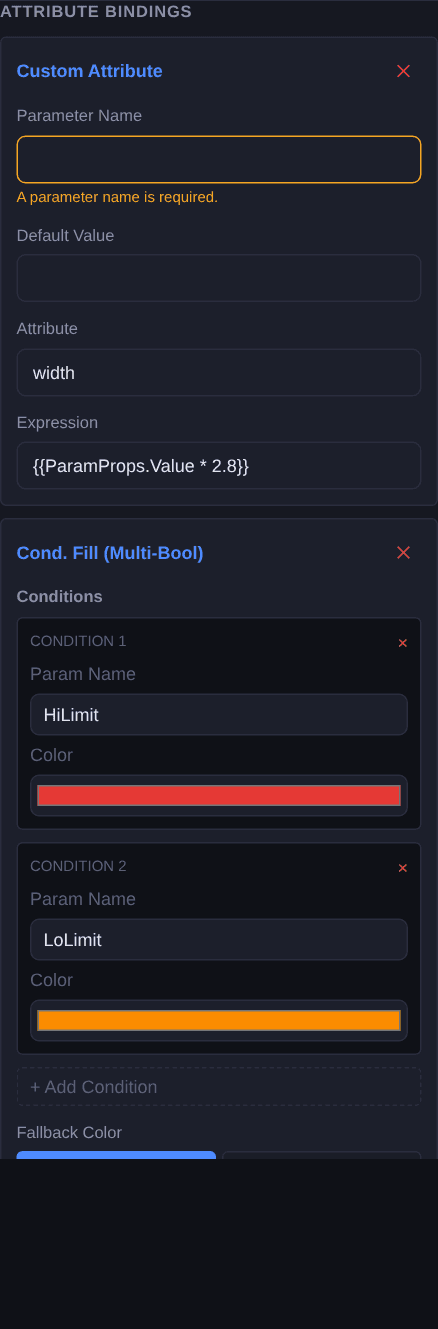
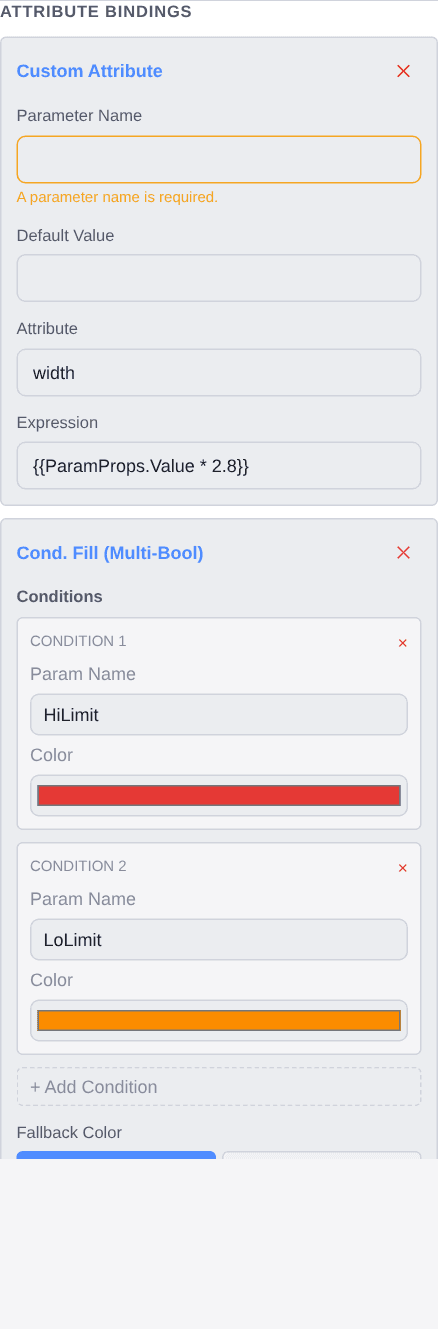
With the bar still selected, add a Cond. Fill (Multi-Bool) binding with two rows:
HiLimitin red, thenLoLimitin amber, with the normal blue as the fallback.Two bindings on the same element is normal and worth getting used to — one drives geometry, the other appearance, and they never interfere.
3. Add the readout
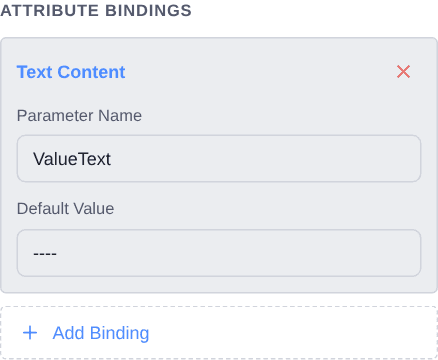
Select the numeric display and add a Text Content binding named
ValueText. A bar answers “roughly how much” at a glance; the number answers “exactly how much” when someone needs it, and a bar without one sends people hunting for a faceplate.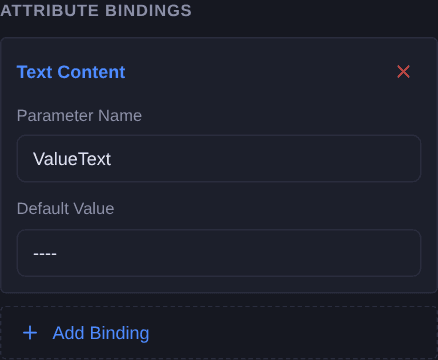
Check it
Open Simulate and drag Value from 0 to 100. The bar should start at nothing and finish exactly at the 100 % tick. If it overshoots the track or stops short, the factor does not match the drawing.
Then set both limit bits at once. It is not a state the plant should produce, but the answer should still be deterministic — the higher row wins, every time.
Simulate needs a free account. Everything up to this point does not.
Variations
- A vertical bar. Drive
heightinstead, and move the top edge with a second expression onyso the bar grows upward from a fixed base. - Scale in the expression. If the tag is in engineering units rather than percent, divide by the range in the same expression:
{{ParamProps.Bar / 16 * 280}}. - Limits from a state number. Swap the multi-bool for Cond. Fill (Number) if your alarm logic publishes one state word instead of separate bits.
Questions
- Where does the 2.8 come from?
- The drawing. The bar is 280 units long at full scale and the value runs to 100, so one percent is 2.8 units. Read it off your own graphic rather than copying this.
- Why not compute the colour from the value?
- Because limits usually carry hysteresis and delays, and reimplementing them in the graphic means two places that can disagree about whether the plant is in alarm. Let the alarm logic decide and have the bar display what it decided.
- Can one element carry two bindings?
- Yes. Here the bar has both a width expression and a colour, which is the normal shape for anything whose size and appearance come from different facts.
- Why is the bar drawn full at design time?
- Because the full-scale geometry is what the arithmetic is derived from. Drawing it full means the factor can be read straight off the element instead of measured.